In the fast-paced world of digital success, it’s not a question of whether to A/B test but how to make the most of it.
Businesses are constantly seeking ways to connect better with their audience, and A/B testing provides both clarity and challenges in this journey.
Deciphering which designs work, dealing with inconclusive results, and getting actionable insights may seem like a struggle, but these challenges are the driving force behind smarter business decisions.
What is A/B testing?

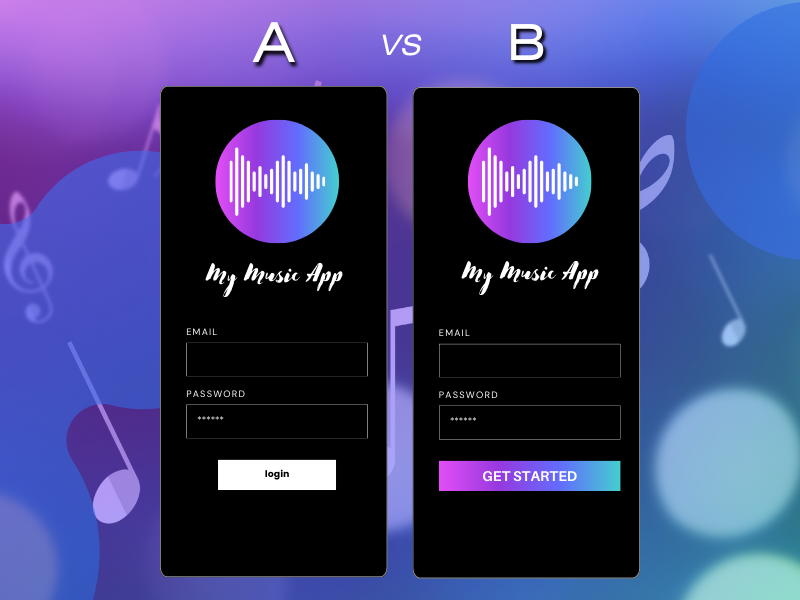
A/B testing is a marketing strategy where you compare two different versions of your website, email, popup, or landing page to figure out which one works best.
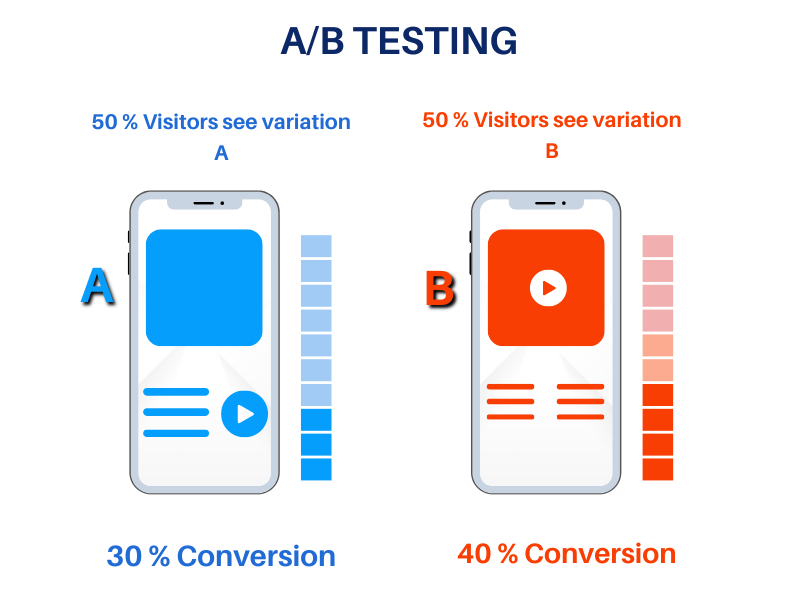
During A/B testing, you split your audience into two equal parts and compare the results to determine which version performs better. You just present version A to one group and version B to another group, and then compare the outcomes.
Why do we use A/B testing?
A/B testing helps you make smart, strategic decisions that can provide a better experience for your audience.
Regularly conducting A/B tests on a product and marketing materials can offer several advantages, such as:
- Increasing Conversions: Let’s say your business’s main goal is to drive conversions – like sign-ups, purchases, or clicks – in this case you might want to try A/B testing, as it can help you improve these metrics.
Even small adjustments identified through testing can lead to significant improvements in conversion rates. - Data-Driven Decision-Making: A/B testing allows you to make changes to your product based on real data instead of guesswork or assumptions.
This means that any changes made to the product are based on actual user behavior and preferences, making your decisions more informed and accurate. - User Experience Enhancement: With A/B testing you can gain insights into how users interact with different elements of your product.
After analyzing the outcomes of the test, you may find out that to enhance user experience you need to refine your content, optimize your design, or improve navigation.
When should we use A/B testing?
A/B testing is recommended in various scenarios. Here are some examples.
- Call-to-Action (CTA) optimization: It can be really helpful if you’re looking to make improvements to things like button colors, text, or the placement of a call-to-action on your webpage, and you want to make the most informed decision based on user preferences.
- User Experience (UX) Design optimization: If you intend to improve the user experience of your website or mobile app you can start by testing out different navigation paths, feature placements, or overall design elements through A/B testing.
- Mobile apps optimization: When it comes to mobile app optimization, A/B testing can help you improve the onboarding process for new users, or test different push notification strategies.
- Marketing strategies optimization: Marketing campaigns often include discounts, free trials, or promotional offers as key strategies. By testing different versions of these approaches through A/B testing, you can gain insights into which one has the best results for your target audience.
How to run an A/B testing experiment?
Step 1. Decide what is the intended outcome of the experiment
Before you start an A/B test, it’s important to know what your objectives are. Depending on what you are trying to achieve you can set up the right experiment and follow the best metric to figure out if the test worked or not.
Here are some possible outcomes to consider.
Example 1. Improving conversion rates
Imagine if you could significantly increase the number of people who take a desired action on your website, such as making a purchase, signing up for a newsletter, or filling out a form. By testing out different variations, you can improve the percentage of users who take these actions.
Let’s see what to consider for starting an A/B test to improve the conversion rate.
- Identify the Conversion Action
Clearly define what constitutes a conversion for your specific experiment. It could be making a purchase, filling out a form, signing up for a newsletter, or any other action that aligns with your overall objective.
- Set a Primary Metric: Conversion Rate
The primary metric to track when improving conversion rates is, unsurprisingly, the conversion rate itself. This is the percentage of users who complete the desired action out of the total number of users who were exposed to the variation.
- Set Secondary Metrics
Consider tracking additional metrics that provide a more comprehensive view of the conversion process. These may include:
- Click-Through Rate (CTR): If your conversion process involves users clicking on a link, tracking the CTR can help understand the effectiveness of your variations in getting users to take the initial step.
- Bounce Rate: Monitoring the bounce rate is important to ensure that the variation not only attracts clicks but also retains users’ interest, reducing the likelihood of them leaving the page immediately. It’s possible that users click on a link to make a purchase, but then abandon the checkout page. This behavior may suggest that there is an issue with the checkout process, where you may need to set up another A/B test.
- Average Order Value (AOV): For e-commerce, if the conversion is a purchase, tracking the AOV can provide insights into the impact of variations on the value of transactions.
Example 2. Improving User Engagement
You may want to test different layouts, formatting styles, and content structures. This can include variations in the placement of images, text, headers, and other elements to find the most visually appealing and user-friendly arrangement.
Now let’s see what to consider for starting an A/B test to improve user engagement:
- Define User Engagement
Clearly outline what user engagement means in the context of your experiment. It could involve metrics such as time spent on a webpage, the number of pages viewed, or the frequency of interactions within an app.
- Set a Primary Metric: Time Spent on Page or App
One of the key metrics for user engagement is the time users spend on a page or within an app. Longer durations generally indicate higher engagement. Track this as the primary metric to assess the impact of your variations on user interaction.
- Set Secondary Metrics
Supplement your primary metric with additional indicators of engagement.
- Pages Viewed per Session: Monitor the average number of pages a user views in a single session, providing insights into the depth of their interaction.
- Return Visits: Assess how many users return after their initial visit, indicating sustained interest and engagement
Tip: To gain a complete understanding of your conversion funnel, it’s worth tracking multiple metrics simultaneously. This approach enables you to pinpoint potential problems at various stages and make specific improvements.
Step 2. Pick one variable to test
A/B testing can be a powerful tool to optimize your website or marketing campaigns. However, when conducting A/B tests, it is highly recommended to test only one variable at a time. Let’s take a look at a couple of reasons why:
- Testing multiple variables simultaneously can make it difficult to determine which variable is responsible for the observed changes in performance.
- When you’re dealing with a single variable in A/B testing, it becomes easier to determine the causal relationship between the variation and the observed changes in user behavior, conversion rates, or other metrics.
- Focusing on one variable in A/B testing allows for efficient resource allocation and gathering of conclusive data without unnecessarily extending the experiment.
- Testing one variable reduces user confusion and ensures a smoother testing experience by avoiding multiple changes that could lead to difficulty in attributing user reactions to specific alterations.
- Adopting a step-by-step approach allows for incremental optimization. Once the impact of one variable is understood, you can build upon that knowledge and iteratively improve other aspects of your product.
Tip: Decide what to test in an A/B test based on your specific goals and priorities. Focus on elements that directly impact user behavior or key performance indicators (KPIs).
Step 3. Create the control and variation
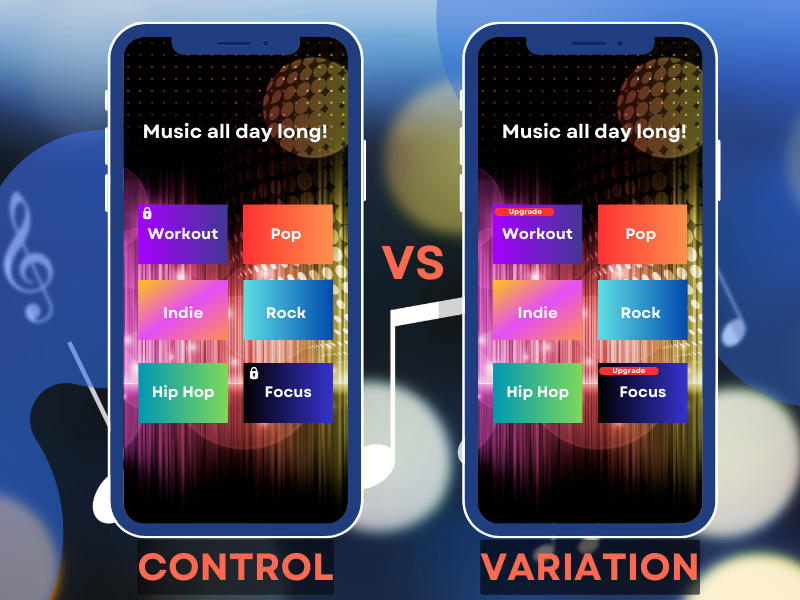
Now that you have a clear idea of your desired outcome and the variation you want to test, you can create an altered version of your idea to ensure its success. Let me show you how this can be achieved with an example from a music app.
The control version of the app’s homepage showcases the current design, with popular playlists being highlighted prominently. Additionally, there’s a button that indicates the requirement for an upgrade if one wishes to access a specific playlist.
Then you come with the variation, also called the challenger, that introduces a new way of displaying the upgrade button.
During this A/B test, you would evaluate conversion rate metrics like click-through rates and bounce rates to determine which version (control or challenger) is more effective in terms of user upgrades

Step 4. Split the users into two equal groups
Making sure that users are randomly and equally divided in A/B testing is very important to get accurate and fair results.
This method helps to make the test more reliable and unbiased. It also ensures that any differences in the results are due to the changes being tested, and not because of other factors.
By having an equal split, it is easier to compare the results of the control and challenger groups.
This approach is also fair to users and avoids any problems that may arise due to uneven exposure to the experimental changes.
Step 5. Decide for how long to test it
To determine the duration of an A/B test, several factors such as sample size, traffic level, and statistical significance are taken into consideration.
It is usually suggested to run an A/B test for at least two weeks to accommodate fluctuations in user behavior over different days and weeks.
Moreover, you should continue the test until you obtain a statistically significant outcome, ensuring that the data collected is adequate to make dependable conclusions.
Step 6. Read the results of the test

To determine if the changes made have led to a significant difference between the control and challenger groups, it is important to examine the statistical significance of the results. This will help you understand if the observed differences are not just due to random chance.
To gauge the impact of the variations, it is recommended to focus on key metrics that are relevant to your objectives. These could include conversion rates, click-through rates, or other performance indicators.
Visual aids such as charts or graphs can be useful in presenting the performance of each variation over time. This can help identify trends and patterns that may not be immediately apparent from raw data.
Analyze the results based on different user segments to gain insights into how different demographics, geographic locations, or other factors respond to the variations. This segmentation analysis can uncover valuable insights that may not be apparent from overall results.
A/B testing metrics examples and when to use them
Click-Through Rate (CTR)
- When to Choose: CTR is crucial when your primary focus is on encouraging users to take the initial step of clicking on a link. Use CTR if your goal is to attract attention, generate interest, or drive users to a specific page or product.
- Example Scenario: A marketing campaign aims to increase website visits, and the first key interaction is users clicking on a promotional link.
Add-to-Cart Rate
- When to Choose: Opt for Add-to-Cart Rate when your primary goal is to gauge users’ interest and commitment to a product or service. This metric is particularly relevant in e-commerce scenarios where adding items to the cart is a crucial step before the final purchase.
- Example Scenario: An online store wants to optimize the product discovery and selection phase, focusing on users adding items to their shopping cart.
Checkout Completion Rate
- When to Choose: If the ultimate goal of your conversion funnel is to drive users to complete a purchase, then Checkout Completion Rate is paramount. This metric specifically measures the successful conclusion of the conversion process.
- Example Scenario: An e-commerce platform aims to reduce cart abandonment and increase the percentage of users who successfully complete the checkout process.
Multivariate testing vs A/B testing
A/B Test
- Number of Variations: In A/B testing, you compare two variations, a control group (A) and a challenger group (B), where only one element is changed. This simple experiment helps you assess the impact of a single modificatio n against the existing version.
- Use Case: A/B testing is ideal for comparing two distinct versions of digital content, such as webpages or emails, to determine which performs better in terms of user engagement, conversion rates, or other metrics.
Multivariate Test
- Number of Variations: Multivariate testing involves testing multiple variations of multiple elements simultaneously. It assesses the combined impact of changes to different elements on user behavior.
- Use Case: Multivariate testing is useful when you want to understand how different combinations of changes to various elements, such as headlines, images, and call-to-action buttons, collectively influence user interactions. By providing insights into the interaction effects among multiple variables, it helps you optimize the performance of digital content.
Conclusion
Despite the challenges that may come with A/B testing, the insights derived from this technique offer much more than just experimentation.
By adopting a culture of data-driven decision-making, A/B testing can help organizations make informed choices that are grounded in empirical evidence.

